Home Glossary Maximum drawdown
Maximum drawdown
Maximum drawdown — The largest fall from a peak in your account to the lowest point that followed it, before a new peak was made.
Drawdown is the number that decides whether you are still trading in a year. It is also the number most badly distorted by the file it is computed from, and almost nobody says so.
In plain English
Walk your account balance forward in time. Every time it makes a new high, that becomes the peak. Every time it sits below the peak, the gap is the current drawdown. The largest gap you ever recorded is the maximum drawdown. It is usually quoted both in currency and as a percentage of the peak it fell from.
It matters more than profit because it is the constraint. A 50% drawdown needs a 100% gain to recover from. A 20% drawdown needs 25%. The arithmetic is unforgiving in one direction only, and every prop-firm rule you will ever meet is written in terms of drawdown rather than profit for exactly this reason.
There is a second figure worth knowing: absolute drawdown, the distance from your initial deposit down to the lowest balance ever reached. It answers a different question — how far below water did I ever go relative to the money I put in — and on an account that got profitable early, it is much smaller than the maximum drawdown.
The formula
Maximum drawdown = max over time of (running peak balance − current balance)
- As a percentage: the same gap divided by the peak it fell from, not by the starting balance.
- Absolute drawdown = initial deposit − lowest balance ever reached.
- Deposits and withdrawals move the balance but are not trading results — TapeSheet includes them in the curve, because your equity really did change, and excludes them from trade statistics.
Worked example — the demo account
The demo account started at $25,000.00 and finished at $26,793.45, with a $2,500.00 withdrawal along the way.
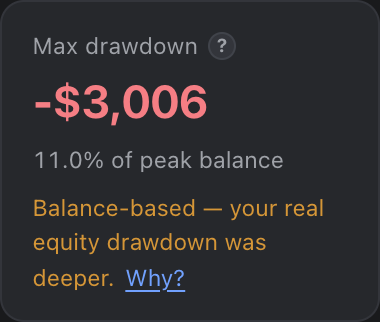
| Maximum drawdown | $3,005.56 | 10.97% of the peak it fell from |
|---|---|---|
| Absolute drawdown | $617.22 | from the initial deposit to the lowest balance |
| Recovery factor | 1.43 | net profit ÷ max drawdown |
A 10.97% maximum drawdown against +$4,293.45 of profit — a recovery factor of 1.43.
Read those together rather than separately. A recovery factor of 1.43 means the account made a little under half again as much, in total, as its worst single decline. That is a modest margin: the same system having a materially worse run would have spent much of the period underwater.
Note also how different the two drawdown figures are. $617.22 absolute versus $3,005.56 maximum — because the account was profitable before its worst decline, so the fall happened from a high-water mark well above the deposit. Quoting the smaller number is a common and quietly dishonest way to describe an account.
Every figure above is from the demo account TapeSheet ships with — 96 closed trades, generated from a fixed seed. Open the same account →
What this does not tell you
The caveat is the part worth reading, which is why it sits next to the number rather than in a footer.
- Your real drawdown was worse than this, and it is not close. An MT4 or MT5 statement records a trade when it closes. A position that ran 400 pips against you for two days and then recovered to close at breakeven contributes nothing at all to a balance-based drawdown — but your equity really did fall, your margin really was consumed, and if the move had continued you would have been closed out. Every drawdown figure computed from a statement, by any tool, is a floor on the truth rather than the truth. TapeSheet says so on the tile.
- It does not say how long you were underwater. A 10% drawdown recovered in a week and a 10% drawdown that took nine months are the same number and completely different experiences. Duration is what actually ends trading careers.
- It does not say how many there were. One 10% fall and six 9% falls both report a 10% maximum. The underwater chart shows the difference; the single figure cannot.
- Percentages depend on what you divide by. Percent-of-peak, percent-of-initial-deposit and percent-of-current-equity give three different numbers for the same event. TapeSheet uses percent of the peak it fell from, and prop firms frequently do not — check which one your firm’s rule means before trusting either.
Where TapeSheet shows it
The Max drawdown tile on the Overview and the “Underwater” chart beside the equity curve, which plots the distance below the running high-water mark for the whole period. The Prop tracker applies firm-style drawdown rules to the same curve.
Questions
Why is balance-based drawdown different from equity drawdown?
Balance changes only when a trade closes. Equity changes continuously while a trade is open. A statement contains closed trades, so any drawdown computed from it skips every intraday excursion — including the ones that came closest to a margin call. The gap between the two is largest for traders who hold positions through adverse moves, which is to say, the traders for whom it matters most.
Is maximum drawdown the same as the max drawdown in my prop-firm rules?
Usually not. Prop firms mostly measure drawdown on equity, in real time, sometimes from a trailing high-water mark and sometimes from a static starting balance, and often with a separate daily limit. Those are four different measurements. The Prop tracker in TapeSheet models several of them explicitly rather than assuming yours.
Related terms
See your own statement, analyzed
Drop an MT4 or MT5 statement on the page and the whole dashboard renders in about three seconds. No signup, no upload — the file is parsed inside your browser tab and never leaves your device.
Analyze my statementAll glossary terms ·Free trading journal ·MT4 statement analyzer ·MT5 report analyzer